Visualizzazione post con etichetta gamma spectrometry. Mostra tutti i post

lunedì 4 marzo 2013

Radioactivity and Cesium in Fukushima soil with gamma spectrometers


(Italian version of this post is here)

Collection of samples in the region of Fukushima
The accident at the Fukushima-1 released large quantities of radioactive material in the air: this is now dominated by radioactive isotopes of Cesium-137 and -134. In a previous post we  compared  measurements of environmental radioactivity, showing how the radiation background  in Rome is higher than in Tokyo.


Spectrum of a source of pure cesium-137

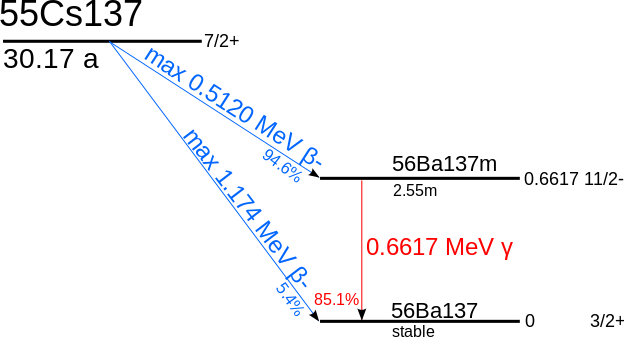
The figure shows the spectrum of gamma rays emitted by an artificial source of cesium-137 acquired with the same spectrometer described in the previous post.The cesium decays into an excited state of barium (emitting an electron and an antineutrino). The de-excitation of barium emits a gamma ray energy of 661 keV. This process is similar to fluorescence, except that this phenomenon is due to excited atomic electrons. The return of the electrons to the ground state emits light (between 2 and 3 eV), that is  electromagnetic radiation. In fluorescence the energy levels in the nucleus are thousands of times more intense and therefore the electromagnetic radiation emitted has an energy thousands of times greater.
To the left (lower energy) of the 661 keV peak you have the " Compton shoulder ", produced by gamma rays hitting and producing an electron  with lower energy than the primary gamma, depending on the angle with which it is issued.
On the far left there is also a peak at 30 keV is also due to the emission of X-ray excitation of barium.

The spectroscopic analysis of a sample of soil in the region of Fukushima collected in January 2013 shows a more complex structure. In this case it is a particularly contaminated sample, took the side of a mountain road between the city of Fukushima and the coast . Other samples are not so active. Presumably the deposition of water and snow did accumulate large amounts of cesium on the edge of the road. As already described in other posts, the eplosions at plant has emitted reactor also cesium-134 which decays into barium with peaks at 600, 790, 1400 and 1600 keV (the latter is out of range of the detector). Each gamna has its Compton shoulder associate: the sum of the various emission produces the characteristic spectrum shown in the figure.
File: Cs-137-decay.svg
Decay pattern of cesium-137 ( from here )
It should be recalled that the cesium-134 has a decay time of two years, for which the presence of these peaks denotes the origin of Fukushima. In other cases the absence of cesium-134 has been used to show how fungi which also had radioactivity above the threshold of 100 Bq / kg were not contaminated by the central, but presumably from previous nuclear tests.
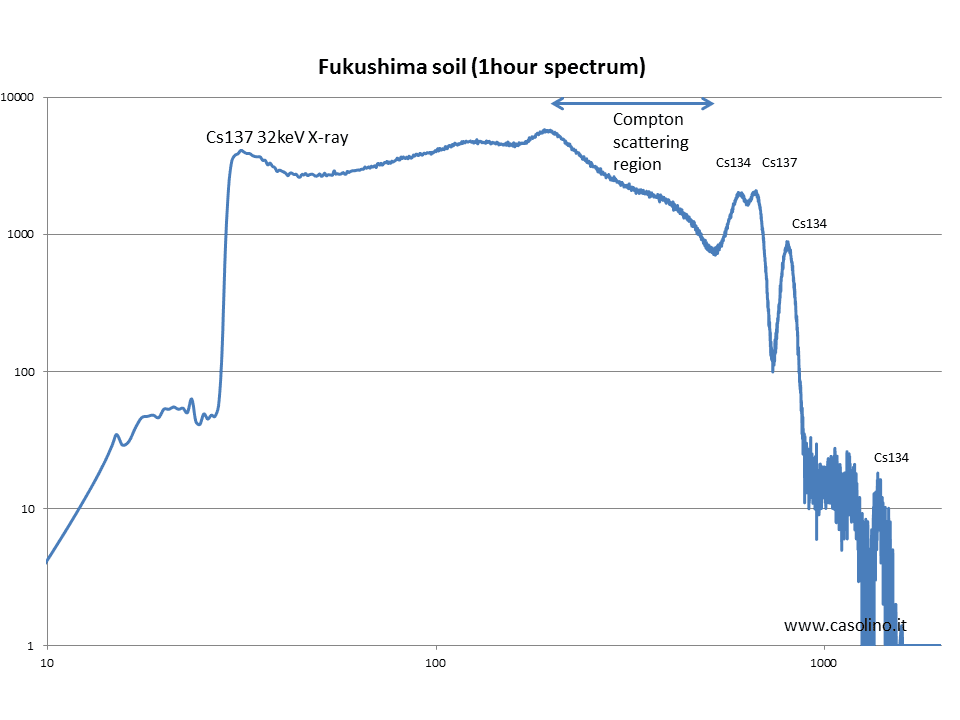
Gamma spectrum emitted by a sample
soil of Fukushima region.
From the decay probabilities  and the height of the peaks can be traced to the relative abundances of different isotopes. Reconstructing the absolute activity of a given sample in Bq / kg is much more complicated because it is necessary to take into account the geometry and efficiency of the detector: it will be the subject of a future post.

venerdì 15 febbraio 2013

Radon from Rome, Cesium from Fukushima: environmental radiation and gamma spectroscopy


The detector C12137, at the bottom right in the photo. 
(iaIt connects via USB to the computer for the acquisition
(Italian version here)
The Fukushima accident released large quantities of radioactive materials in the environment, especially iodine and cesium. Iodine decayed in  a few weeks, leaving  cesium-134 and 137 as potential contaminants of the environment and food. A Geiger counter is sufficient to measure the amount of environmental radiation. This detector, however, counts indistinctly each gamma ray that hits it, regardless of the energy of the particles.To estimate the amount of cesium in the environment (and especially in food) is necessary a spectrometer, capable of determining the energy of gamma rays. Since each isotope emits gamma rays of specific energies, from the analysis of the peaks, it is possible to determine the amount  of the various isotopes present.
Recently, Hamamatsu photonics, a company specializing in the development of detectors for space physics, particle and medical devices, has released a portable detector ( C12137) with a crystal to stop the gammas (CsI) and a Silicon Photmultiplier (or a MMPC as they call them) to reveal the energy by measuring the emitted light . The simplicity of this relatively new detector, invented by a Russian scientist, is that it does not requires high voltages, is as small as a pack of cigarettes and you can connect to any USB port. As all  spectrometers,  however, the cost is about 20 times that of a Geiger counter.

The  picture above   shown the radiation in Rome, in a fourth (fifth by Japanese counting) floor apartment: it is 0.25microSv/hour (with peaks of 0.35).
As mentioned, the advantage of the gamma spectrometer, however, is to count, for each decay, the energy of the rays that hit him. In about an hour and then it is possible to obtain a spectrum which describes the type and amount of ambient radiation. To improve the statistics and better highlight the peaks is, however, advisable to wait a while longer. In the figure below you can see how the spectrum in Rome (and in much of Italy) is dominated by radon 222, a noble gas source to the high amount of environmental radiation. Usually the radon comes from the subsoil and from tuff, but in this case, being a flat on the fourth floor, is more likely to come from pozzolanas of construction materials. 

Spectrum of the radiation environment in a home 
of Rome. The peaks of radon 222 are clearly visible. 
Spectrum of an hour equivalent averaged over 7 hours

The figure below compares two spectra  taken in Rome with two acquired in Japan. The value of Rome is the higher (0.25microSv /h), followed by the basement laboratories of Tor Vergata University in Rome(0.10 microSv / h, where, however, there is not much radon), Kokubunji (0.05), and the fourth floor in Wako (0035 microSv / h).Note the almost total absence of radon in Japan (in the onsen, however, may be  higher). The peak at 1460 keV is probably due to Potassium 40 (aka Calium - the same present  in bananas).
Radiation comparison between Italy and Japan. 
The radioactive background is higher in Rome than in Tokyo

The arrow marks the 660 keV regiorn where   the peak of cesium 137 should be located: as is evident there are no measurable quantities of this species above the bottom of the radiation environment. 

Cesium can be detected detected in various hotspots in the region of Fukushima and in soil samples: this topic will be discussed in a next post.

(1) continues
Previous post on this topic in english:

Let's measure Radiation: the radioactivity of everyday objects 放射線を測って見よう (also in Japanese)


Survivalism and the real radiation contamination in Japan